mirror of
https://github.com/nikolaydubina/calendarheatmap.git
synced 2025-02-12 16:06:06 +02:00

![]()
![]()
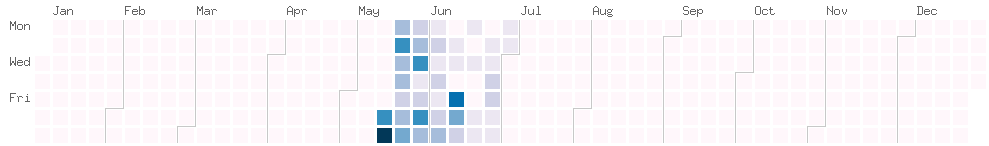
Self-contained, plain Go implementation of calendar heatmap inspired by Github contribution activity.
Basic
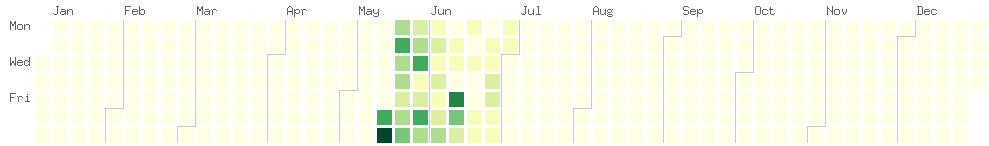
Colorscales

Without month separator

Without labels
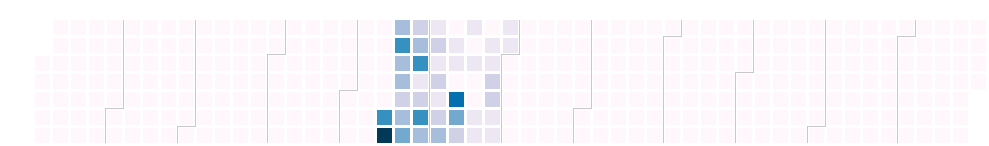
Without labels, without separator

Example module, next save output in formats supported by image module (PNG, JPEG, GIF).
countByDayOfYear := map[int]int{
    1: 10,
    22: 15,
    150: 22,
    366: 55,
    ...
}

img := charts.NewHeatmap(charts.HeatmapConfig{
    Year:               2020,
    CountByDay:         countByDay,
    ColorScale:         colorscales.PuBu9,
    DrawMonthSeparator: true,
    DrawLabels:         true,
    ...
})
Example script,
$ go build; ./calendarheatmap -h

Usage of ./calendarheatmap:
  -colorscale string
        refer to colorscales for examples (default "PuBu9")
  -input string
        file should contain lines in format: 2020-05-16 20:43 PPPP (default "input.txt")
  -intput-format /parsers
        format of input file (json-basic) refer to /parsers for examples (default "row-day-seconds-count")
  -labels
        labels for weekday and months (default true)
  -monthsep
        render month separator (default true)
  -output string
        output filename, will export as PNG (default "chart.png")
  -output-format string
        output format (png, jpeg, gif) (default "png")
TODO:
- SVG support
- select start and end date